Knowledge Hub
Complete guide to understand and measure the performance of your website.
To get started, we’ll go into the crucial metrics we need to measure on any site nowadays. Then, we’ll break down the types of data, lab and field, and the techniques that will help us to assess and analyze them.
What is Web Performance in 2022?
The term performance, in the technology sector, refers to the monitoring and measurement of relevant metrics to assess the performance of certain resources. We can talk about performance both when we talk about people and when we talk about projects or products.
For example, you can measure the performance of a Scrum team by studying the metrics that this methodology provides, as well as the performance of a server by reading metrics such as its response time.
Web performance, on the other hand, is an objective measurement of how well the website performs from a User Experience (UX) perspective. Web performance will make you ask yourself questions such as: Does our page load quickly?, or Can a user click on a link as soon as it renders on the page?
Ultimately, its main objective is to enable a user to access and interact with the website’s content as quickly and efficiently as possible.
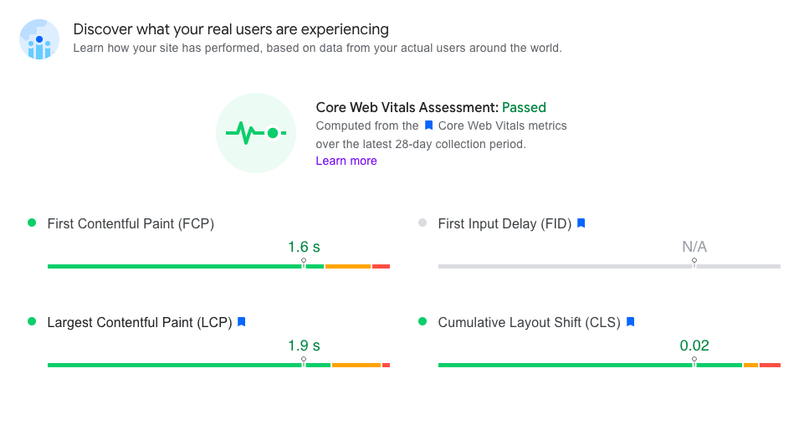
Mobile Core Web Vitals summary — PageSpeed report
As you can see from the definition of web performance, it isn’t something we can leave out of our website. How our website is performing will affect how others perceive our brand and, therefore, the success of our product.
To ensure that our users have a good experience on the site, we need to work on improving the performance. This involves using techniques and tools to measure the real and perceived speed of the site, giving us ideas on where and how to optimize it.
But improving performance is not a “set and forget” task, it is actually something we need to monitor constantly once it has been optimized to ensure that it stays that way in the long term.
To find out what web performance is all about in detail, the big names have great guides as
Focus in 2022: User experience and Web Vitals
UX and accessibility
Since the release of Web Vitals in 2020, web performance is moving towards improving the user experience and accessibility of websites. A trend that will continue during 2022.
After all, if we want more users to visit our website, stay and share it, building a website that is usable on any device and network type is a must. Bearing in mind that when building a website we will be using HTML, CSS, and JavaScript, and files as fonts or images, the frameworks or tools we choose will positively or negatively impact the performance of our site.
Modern web architectures such as Jamstack, designed to make the web faster and more secure, and tools like the **Image Transformation API**s, make it easier to achieve decent performance thresholds without overcomplicating the development.
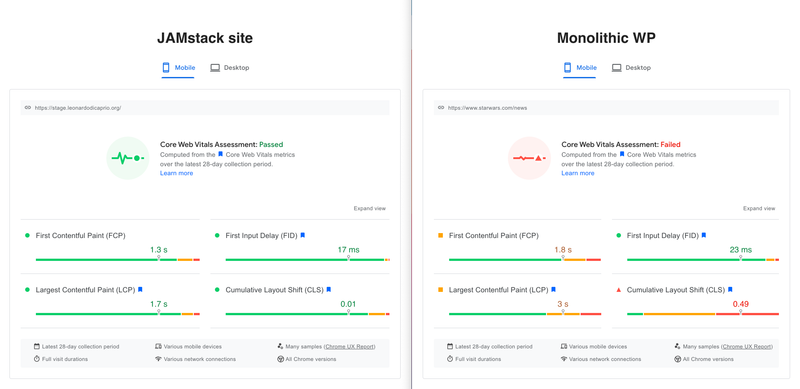
Jamstack site vs Monolithic WP Web performance assessment — PageSpeed Insights
Web Vitals
Web Vitals is a Google initiative that helps quantify and optimize a website's user experience across several essential metrics and aims to simplify the big picture by focusing on the metrics that matter.
Three of these metrics, which we will describe in the next section, constitute the "Core Web Vitals". These metrics are considered the most critical in understanding the real usage of our site, quantifying measurements of page speed and user interactions.
To better understand the impact of Core Web Vitals on Google search ranking, how it was launched and its status today, I recommend you take a look at the series
Web Vitals, and its core metrics, should be present in the decision-making process when building a website. But no one can assure us that these metrics and its thresholds will not change in the future, and therefore it is our responsibility as developers to keep up to date, to continue offering a high-quality experience.
Of course, Google makes it easy for us by adding the changes in this public file
Promising new features
The new Lighthouse user flow API is one of this year's highlights, it allows us to also measure the performance of our website during interactions and automate simulations of those interactions by creating a Puppeteer script.
Although Chrome DevTools already allows you to record a user flow (Recorder tab), if you are interested in knowing how to code it yourself, take a look at the tutorial
What metrics are important to measure
Nowadays, as defined by Google, there are 7 user-centric metrics, the web vitals, that are important to measure to understand the performance of our website.
But knowing that 2022 will be governed by the Core Web Vitals, it will be better to explain what each metric consists of in relation to the related CWV.
Core Web Vitals metrics: LCP, FID and CLS
Each of the Core Web Vitals represents a different state of the user experience:
- loading
- interactivity
- visual stability
While the goal of these metrics is to provide results by measuring in the field, that reflect how the real-user experience is performing, with other Web Vitals metrics, we can also understand the health of our performance in the lab as well.
This will be explained in detail in the sections
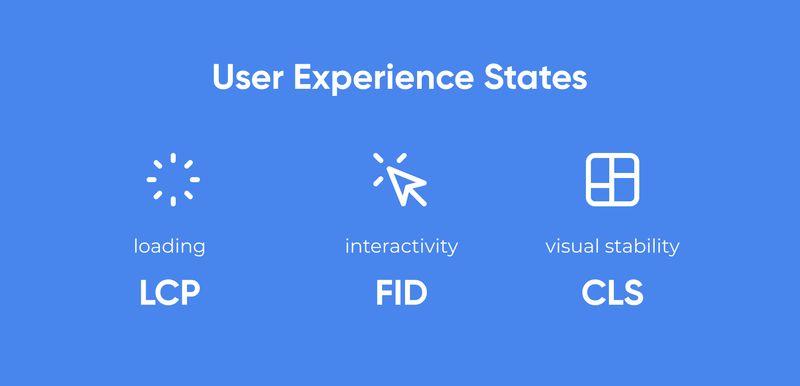
User Experience states by metric: loading (LCP), interactivity (FID) and visual stability (CLS).
If we want our site to perform well, one of the things to keep in mind when evaluating Core Web Vitals, is that 75% of page views should meet the “good” scores for all 3 metrics.
For all metrics, to make sure you are hitting the recommended target for the majority of your users, a good threshold to measure is the 75th percentile of page loads, segmented between mobile and desktop devices. — by Google
Core Web Vitals are here to stay, and any site hoping to rank needs to make sure it’s passing the CWV assessment. So, let's look at the metrics involved and the required scores:
- Largest Contentful Paint (LCP) — content loading
- Measures the time it takes for a website to render the largest content item, the most visible, in the user's viewport. Such content can be an image, as you can see in the example below, or a text.
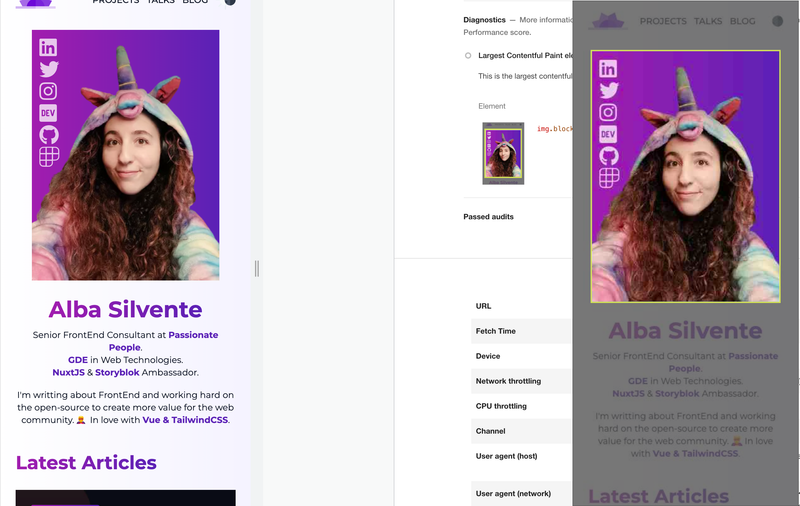
- On dawntraoz.com the main content that LCP measures is an image.
- Unlike the First Contentful Paint (FCP) metric, which captures the beginning of the loading experience and indicates the time it takes for the first element to appear in the user's browser, LCP gives you information much closer to how a user sees the page load.

- LCP score range — Google web.dev
- The LCP indicates that to provide a good user experience, the loading of the main element should occur between 0 and 2.5 seconds after the page has started loading. To get within this range, we must improve the Time to First Byte (TTFB) metric, avoiding slow server response times to ensure that the download starts immediately, and decrease the resource load times.
- First Input Delay (FID) — interactivity
- Measures the time that elapses from when a user first interacts with a page until the main browser thread is idle and can begin processing event handlers in response. Such interaction can be clicking on a link, a button or any other control.
- The aim of FID is to measure the responsiveness of your website, it gives you a signal that determines when your site needs optimization to provide a pleasant user experience.

- Smashing Magazine Jamstack site score for the Core Web Vital metric: FID — PageSpeed report
- Usually, the longest First Input Delays happen between the First Contentful Paint (FCP), when the first page element has been rendered, and the Time to Interactive (TTI), when the page is fully interactive and the main thread is “unblocked”.
- This time gap is measured by the lab metric
- This occurs because if a user interacts with the page when the page has only rendered some content but still needs to load resources, it will cause a delay between the interaction and the main thread responding to it.

- FID score range — Google web.dev
- FID indicates that to provide a good user experience, the first interaction should be handled between 0 and 100 milliseconds after the user has pressed the control. To stay within this range, we should minimize the time gap between FCP and TTI and avoid long tasks (above 50 ms) by splitting the code into different chunks, as recommended by the Total Block Time metric.
- If the main thread has smaller tasks, the user will be able to see a response to their interaction sooner, as there will always be a small amount of free space between tasks.
- Cumulative Layout Shift (CLS) — visual stability
- It measures the largest burst of layout shift scores for each unexpected position change, not caused by user interaction, that happens during page load.
- A
- It also helps to determine how stable a web page loads and quantify how often users experience unexpected layout shifts.
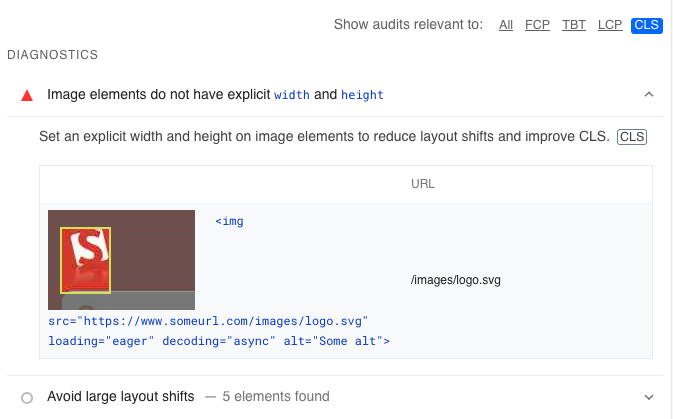
- Sample recommendation for improving our website's CLS from PageSpeed/Lighthouse report
- The most common problems we will encounter when improving this metric come from elements that change size or appear asynchronously. Among them, we find images without their width and height attributes defined (as in the above example), fonts that take a long time to load and are very different from the initial one, or dynamic content (third-party) that suddenly appears on the screen.

- CLS score range — Google web.dev
- CLS indicates that to provide a good user experience, pages should maintain a CLS from 0 to 0.1. To be within the range, we must always include size attributes in the elements that require it, and not insert content above the existing one without a user action.
What is lab data (synthetic monitoring)?
Lab data, or synthetic monitoring, monitors and collects the values of performance metrics in a development or test environment. It is used as an additional resource for performance testing when new features are being developed and avoid problems in production.
These measurements are usually taken in an environment with a predefined set of conditions using automation tools such as scripts that simulate user flow through the website. In short, the idea is to simulate users entering your website to study its performance before publishing it and, once published, to check that everything is working as expected.

Lighthouse Lab Data Report
Measurement in the lab is important when analyzing and improving the user experience in pre-production environments, as the developers can integrate the measurements into their workflows and take immediate actions.
But it doesn't end there, in production environments users will have very different experiences depending on their network type, which browser they are using, ..., therefore we should use a measurement technique called RUM, which we will explain later in this article.
How to measure lab data?
After understanding how synthetic monitoring works, it is time to learn about the metrics available in the lab, the tools that will help us measure that metrics and how to analyze them to take actions to improve the site’s performance.
Useful metrics for synthetic monitoring
Core Web Vitals are known as field measurements, since they study the behavior of real users, as we will see in the next section. But this does not mean that we cannot measure, study and anticipate their values in the laboratory.
In fact, as we already mentioned when describing the metrics, the Core Web Vitals are complemented with other metrics such as TBT, TTI, FCP, ...; and these are the ones we will use in the lab. Let's see for each Core Web Vital the possibilities we have:
- Largest Contentful Paint (can be measured): As in pre-production environments the largest element is usually the same as in production, we can be guided by the same metric, but always rely on the other metrics to achieve the most accurate result possible.
- First Input Delay (can’t be measured without TBT): Since FID measures the delay that may occur the first time a user interacts with the page, if there is no user, it cannot be measured. Fortunately, as we already know, it is not the only metric that gives us values related to interaction, the Total Blocking Time (TBT) tells us how long the main thread is blocked during page load and, therefore, the time when it will cost more to respond to an interaction. Improving this time should improve the FID, respectively.
- Cumulative Layout Shift (can be partially measured): Although this measurement can be obtained in the lab without further tricks, the lifetime of a page in a controlled environment is different from when a real user interacts with it. In these simulations, layout shifts are usually studied during the first load of the page and not throughout the interaction within the page, resulting in lower-than-production results.
Tools available for lab data
The following tools can be used to measure the Core Web Vitals in a lab/synthetic environment:
- Chrome DevTools tabs:
- Lighthouse: It provides a report on all metrics, except FID, with a list of improvements we can make to improve our site's performance. Although we have always used it in its extension format, we can also use it from its Tab in DevTools or even in automated processes with its CI.
- Recorder: In this Tab, you will come across the new user flow API that Lighthouse provides us with. It allows us to perform performance lab testing at any point in the life of a page, but especially beyond the start of it, which is where the other lab reports fall short.
- Performance: This tab shows all page activity during the time period we record. It gives us a much deeper insight into the performance of our site, more complex to analyze than the other tools. In order to take full advantage of it, you need a developer experienced in performance and this type of metrics.
- WebPageTest Web Vitals: This web allows you to choose the device and the type of network from which you want to get your page metrics. It's still lab because it's automated, but at least you can focus on slower networks to get worse results and try to improve them!
- Web Vitals Chrome Extension: This extension measures and reports LCP, FID and CLS for a given page in real time, so you can change your code and see if it improves performance at a glance.
What is field data (real user monitoring — RUM)?
Field data, or real user monitoring (RUM), collects the values of performance metrics in a production environment, experienced by real users. It is used for passive tracking, as it accumulates the values and interactions of users visiting our site, which helps us understand usage patterns, including where users live and the impact on the user experience, and long-term trends.
These measurements are usually performed in a real environment, with real users having different devices, browsers, networks and locations; using a script, this time without simulations, to measure the performance experienced on each page and report the load data for each request.
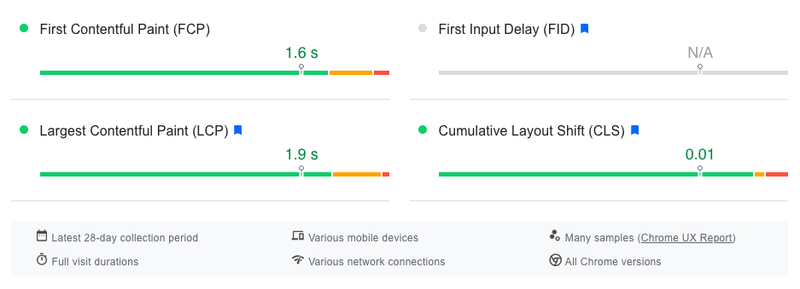
PageSpeed Insights Field Data Report
In the end, as we already mentioned in lab data, the only way to know how a user experiences your website in different conditions, bad signal, old device, ...; is to measure the performance while that user is browsing your page.
How to measure and read field data
Now that we know the concept, let's look at how to measure it, what tools are available now and how we can collect our own data and analyze it.
Tools available for RUM data
These are the tools you can use to measure the Core Web Vitals of your Jamstack site in a real environment:
- DevTools Tabs we already mentioned in lab: Performance, Recorder and Lighthouse.
- Google Extensions:
- Web Vitals Chrome Extension, also useful in the lab, measures each of Core Web Vitals metric and display them as you browse the web without writing any code. You can see the results from your own site or from other websites too.
- Lighthouse Extension.
- Chrome User Experience Report (CrUX): Google has created a report collecting data from real users browsing millions of sites from Chrome. It gives Core Web Vitals data on pages with large amounts of traffic, as it needs enough samples to give results. It can be very useful if you haven't collected your own data yet, but remember you need to have enough visitors to see results. If you would like to see this report represented, you can view it at CrUX dashboard.
- Additionally, Chrome UX Report allow you to use its API to build your own custom reports or tools.
- Websites:
- PageSpeed Insights (PSI) (powered by CrUX data): It reports data obtained by CrUX and Lighthouse. The perfect tool to study the performance of a page if we aren't collecting our own data anywhere. To see results in Core Web Vitals we would need to have a large amount of traffic, as mentioned in the report, which won’t be possible for all sites, even less if we are just starting out.
- Search Console's Core Web Vitals report (Also powered by CrUX): If you are the owner, you can view a report of historical performance data for any page grouped by type. It usually groups pages by their similarities, for example, it would group pages that look like articles into the same category.
- Third-party RUM tools: Cloudflare, New Relic, Akamai, Calibre, Blue Triangle, Sentry, SpeedCurve, Raygun.
Google recommends supplementing these tools with field data collected by you. Measuring your own data helps identify potential issues and provides more details about your site's performance, let's do it!
Measuring your own RUM data
One of the options you have to be able to measure your own site's RUM data is to use the web-vitals JavaScript library. But if you don't want to develop a solution by yourself, you always have field data providers with reports in Core Web Vitals available.
Web-vitals
Without the web-vitals library, by simply using JS and web APIs like Layout Instability API or Largest Contentful Paint API, it’s perfectly possible to measure your RUM data. In fact, there is a section in the Google guides for each metric that explains how to implement it yourself. The problem is that you would have to redo all the logic that others have already implemented for you in this library.
In the following code you will see how easy it is to measure the three main metrics using the JS library, just calling the corresponding method and voilà!
import { getCLS, getFID, getLCP } from 'web-vitals'

// A method to send the result to Analytics or wherever you want to report it.
const reportMethod = (result) => {}

getCLS(reportMethod)
getFID(reportMethod)
getLCP(reportMethod)
See the web-vitals documentation for more information on implementation, and the web-vitals limitations section to know when it’s not possible to measure a metric.
Remember to save the collected measurements in your analytics tool, otherwise you will never be able to analyze them or create a report from them. There are dozens of online guides explaining how to send web-vital results to the most commonly used analytics providers.
Analyzing the data collected
Now that we have the data by the web-vitals library, and we have sent it to our trusted provider, we only have to interpret it and start acting to improve our site.
One of the things we have to keep in mind when we start analyzing field data, is the threshold that every page must meet, the famous 75th percentile, where 75% of visits should get results specified as "GOOD" according to each metric.
First Input Delay, on the other hand, tends to vary quite a bit at the 75th percentile, which is why it has been proposed to analyze a different threshold, between 95th and 99th to be able to observe the worst experiences and thus improve our site.
To get ideas on how to analyze the data, I recommend you take a look at this three-step workflow guide.
Best practices and resources to improve your performance
As you may have noticed, when searching for performance on the Internet, we find thousands of articles to start improving our website. In this section, I leave you the resources that can be most useful to you and a summary of the best practices that will save you big headaches.
Web Vitals patterns
A collection of common UX patterns optimized for Core Web Vitals. This collection includes patterns that are often tricky to implement without hurting your Core Web Vitals scores. You can use the code in these examples to help ensure your projects stay on the right track. — Google
Best practices to improve your Core Web Vitals scores:
Below, I list some of the best practices for optimizing each of the Core Web Vitals, with their respective detailed guidelines and a summary table.
- Optimize Largest Contentful Paint (LCP): Preload and compress images and fonts above the fold. Use modern formats like WebP or AVIF for images, use image CDNs to serve them and transformation APIs to resize them. Use efficient compressors like Brotli for all file types and Zopfli for fonts.
For improving LCP, I recommend you this article from CSS Tricks Improve Largest Contentful Paint (LCP) on Your Website With Ease
- For improving LCP, I recommend you this article from CSS Tricks
- Optimize First Input Delay (FID): Although in the Lighthouse report we already see recommendations for improvement, under the TBT metric, that help us to optimize the value of FID, there are certain practices that will avoid problems in the long run. We can avoid having JavaScript blocking the main thread by splitting the code into small chunks, using the code splitting technique and preloading the most critical files while lazy-loading the ones that are not critical.
- Optimize Cumulative Layout Shift (CLS): It is recommended to have width and height attributes on all images or at least a defined aspect-ratio, as well as content that will be dynamically loaded, such as third party ads. Always make use of when adding any font family to your site.
Optimizations summary
| Images (LCP, CLS) | JavaScript (FID) | Third-Parties (CLS) | Fonts (LCP) |
|---|---|---|---|
| Preloading hero images | Code splitting | Setting height for dynamic content | Make use of font-display: swap; when adding a font family. |
| Using WebP image format and compress | Preloading critical JS | Reserving space for ads above-the-fold | Use `<link rel="preload">` to preload WebFonts, or @font-face for custom fonts. |
| Using Image CDNs / Image Transformations API | Removing render-blocking and unused JS | Deferring third-party JS | Compress the font files with Zopfli or GZIP. |
| Deferring non-critical images | Loading less JavaScript upfront: Lazy-loading non-critical JS | Facades for late-loading content | |
| Specify width and height attributes | |||
| Specifying aspect ratio |
Closing words
As you may have realized, measuring the performance of your website is not something you should do once before publishing and forget about it afterwards. It is important to keep your team and site up to date and optimize the site more and more overtime.
I hope these tips, resources and explanations will be useful for your next goals and that we can make this website a better place together.